|
Journal Metrics |
Journal-level metrics are quantitative measures used to assess the impact and influence of academic journals based on the number of publications and citations the publications received in the journal. Journal-level metrics serve multiple purposes, including assessing the influence and prestige of journals for comparison and ranking purposes. They also inform authors' publication choices, as well as provide evidence of the impact and dissemination of previous research outputs when applying for grants or funding. Researchers can utilize journal metrics to identify high-impact journals within their field, facilitating collaboration and networking opportunities with other researchers who publish in those journals. |
What is it
CiteScore is an annually released metric that measures the citation impact of peer-reviewed research in serial titles, including journals, book series, conference proceedings, and trade journals indexed by Scopus.
Calculating the CiteScore is based on the number of citations to five peer-reviewed document types (articles, reviews, conference papers, book chapters, and data papers) by a journal over four years, divided by the number of the same document types indexed in Scopus and published in those same four years.

Reference: https://service.elsevier.com/app/answers/detail/a_id/14880/supporthub/scopus/kw/citescore/
How to find it
| Scopus > |
|
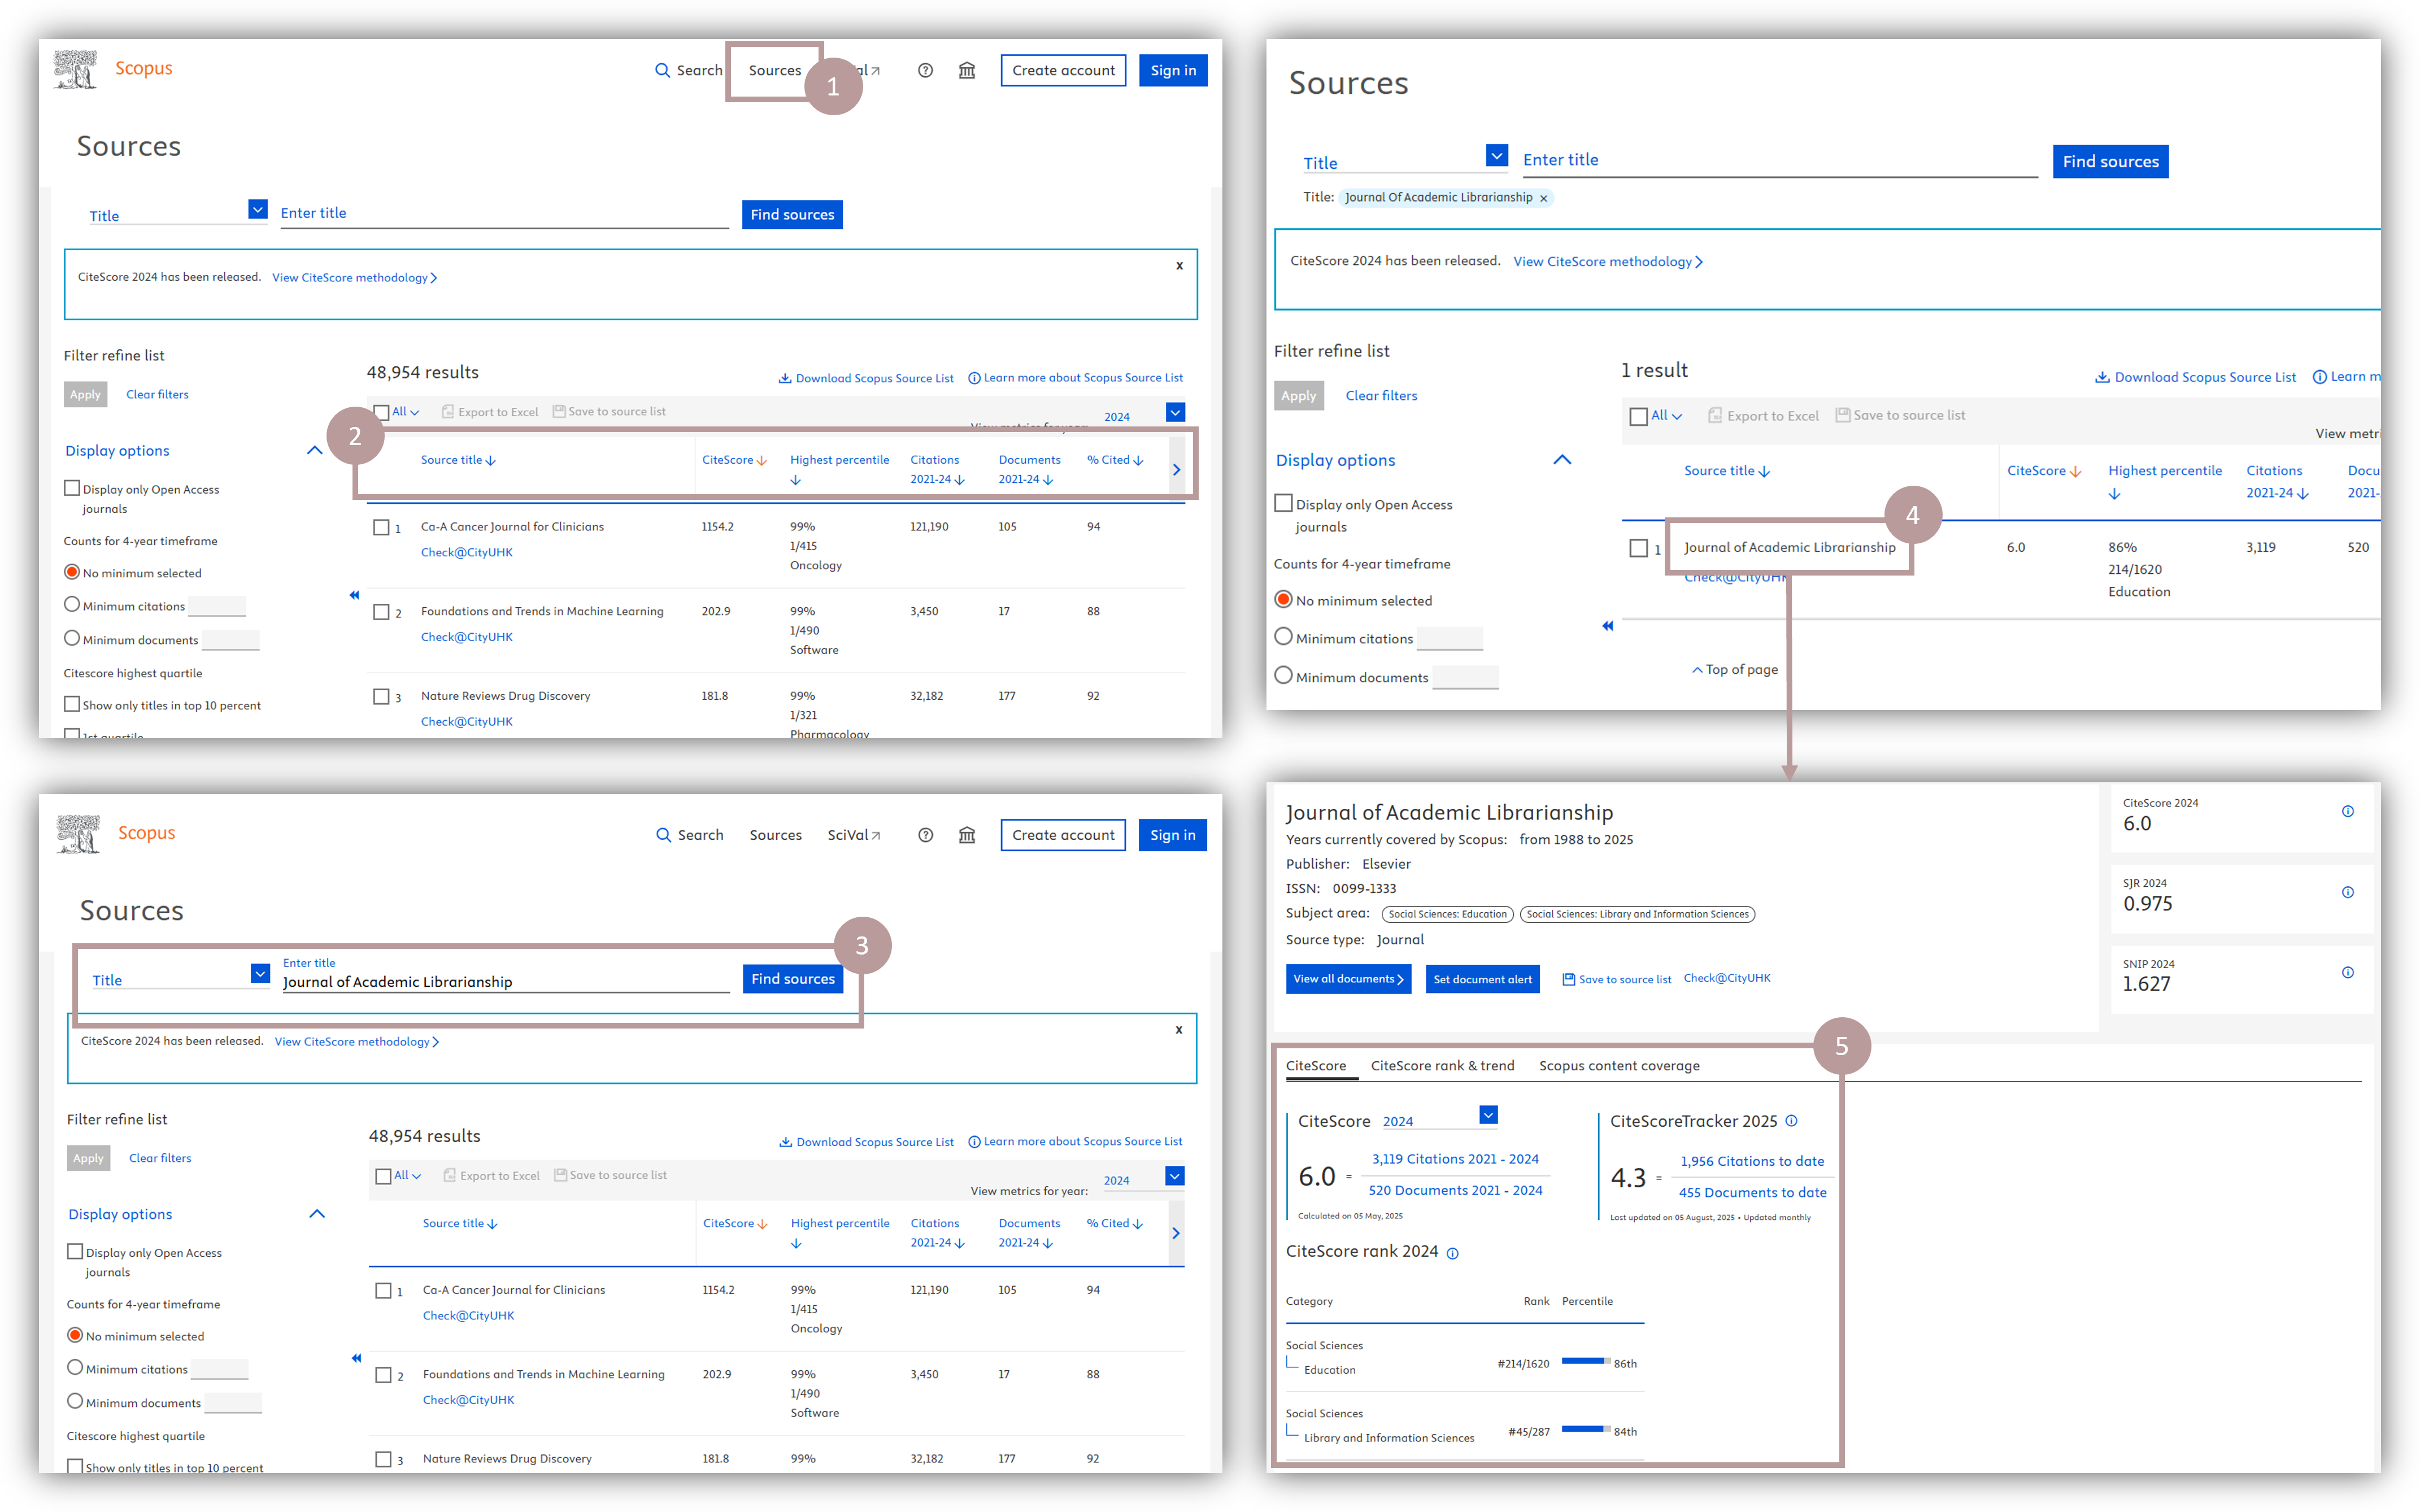
1. On Scopus, click "Sources" on the top of the page. CiteScore can be found on the journal list below, next to each title. 2. If you have a particular journal in mind, search it by title or ISSN. 3. Click the journal name and view the CiteScore-related metrics on the next page. 4. Click "CiteScore rank & trend" to view the detailed rank table and trend bar chart on the next page.
|
CiteScore Rank
CiteScore Rank reflects the rank position of the serial title (e.g. a journal, book series, or conference series) in its subject area (All Science Journal Classification Codes (ASJC)). A title receives a CiteScore Rank for each subject area in which it is indexed in Scopus. This rank is determined by sorting journals from highest to lowest CiteScore within the same subject area.
CiteScore Percentile
CiteScore Percentile indicates a serial title's rank within its subject area. Similar to the CiteScore Rank, a title receives a CiteScore Percentile for each subject area in which it is indexed in Scopus. The higher the CiteScore, the higher the CiteScore Percentile.
The 99th percentile represents the highest CiteScore Percentile, as the 100th percentile does not exist. A journal cannot rank higher than all journals in its field because it is part of that field. Scopus calculates percentiles by rounding them down to the nearest whole number, resulting in a CiteScore Percentile range of 0% to 99%.
A journal with a CiteScore Percentile of 99 ranks higher than 99% of other journals in its subject area, placing it in the top 1% of its field.
Highest CiteScore Percentile indicates a title's highest CiteScore Percentile from all subject areas in which it is categorized.
CiteScore Quartiles
Based on the CiteScores within each subject area, serial titles are split into four equal quartiles, with the Top 10% of titles also available.
| Quartile | Percentile | |
| Q1 | 99-75th | Top 25% of titles with the highest CiteScores within a subject field, including the Top 10% of titles (99-90th) |
| Q2 | 74-50th | |
| Q3 | 49-25th | |
| Q4 | 24-0th | Bottom 25% of titles with the lowest CiteScores within a subject field |
CiteScore Tracker
A monthly updated metric that measures a title's current-year performance. It is calculated in the same way as CiteScore, but for the current year rather than previous, complete years.
Reference: https://service.elsevier.com/app/answers/detail/a_id/30562/#panel2
How to find CiteScore-Derivative Metrics using the source list?
| Scopus > |
|
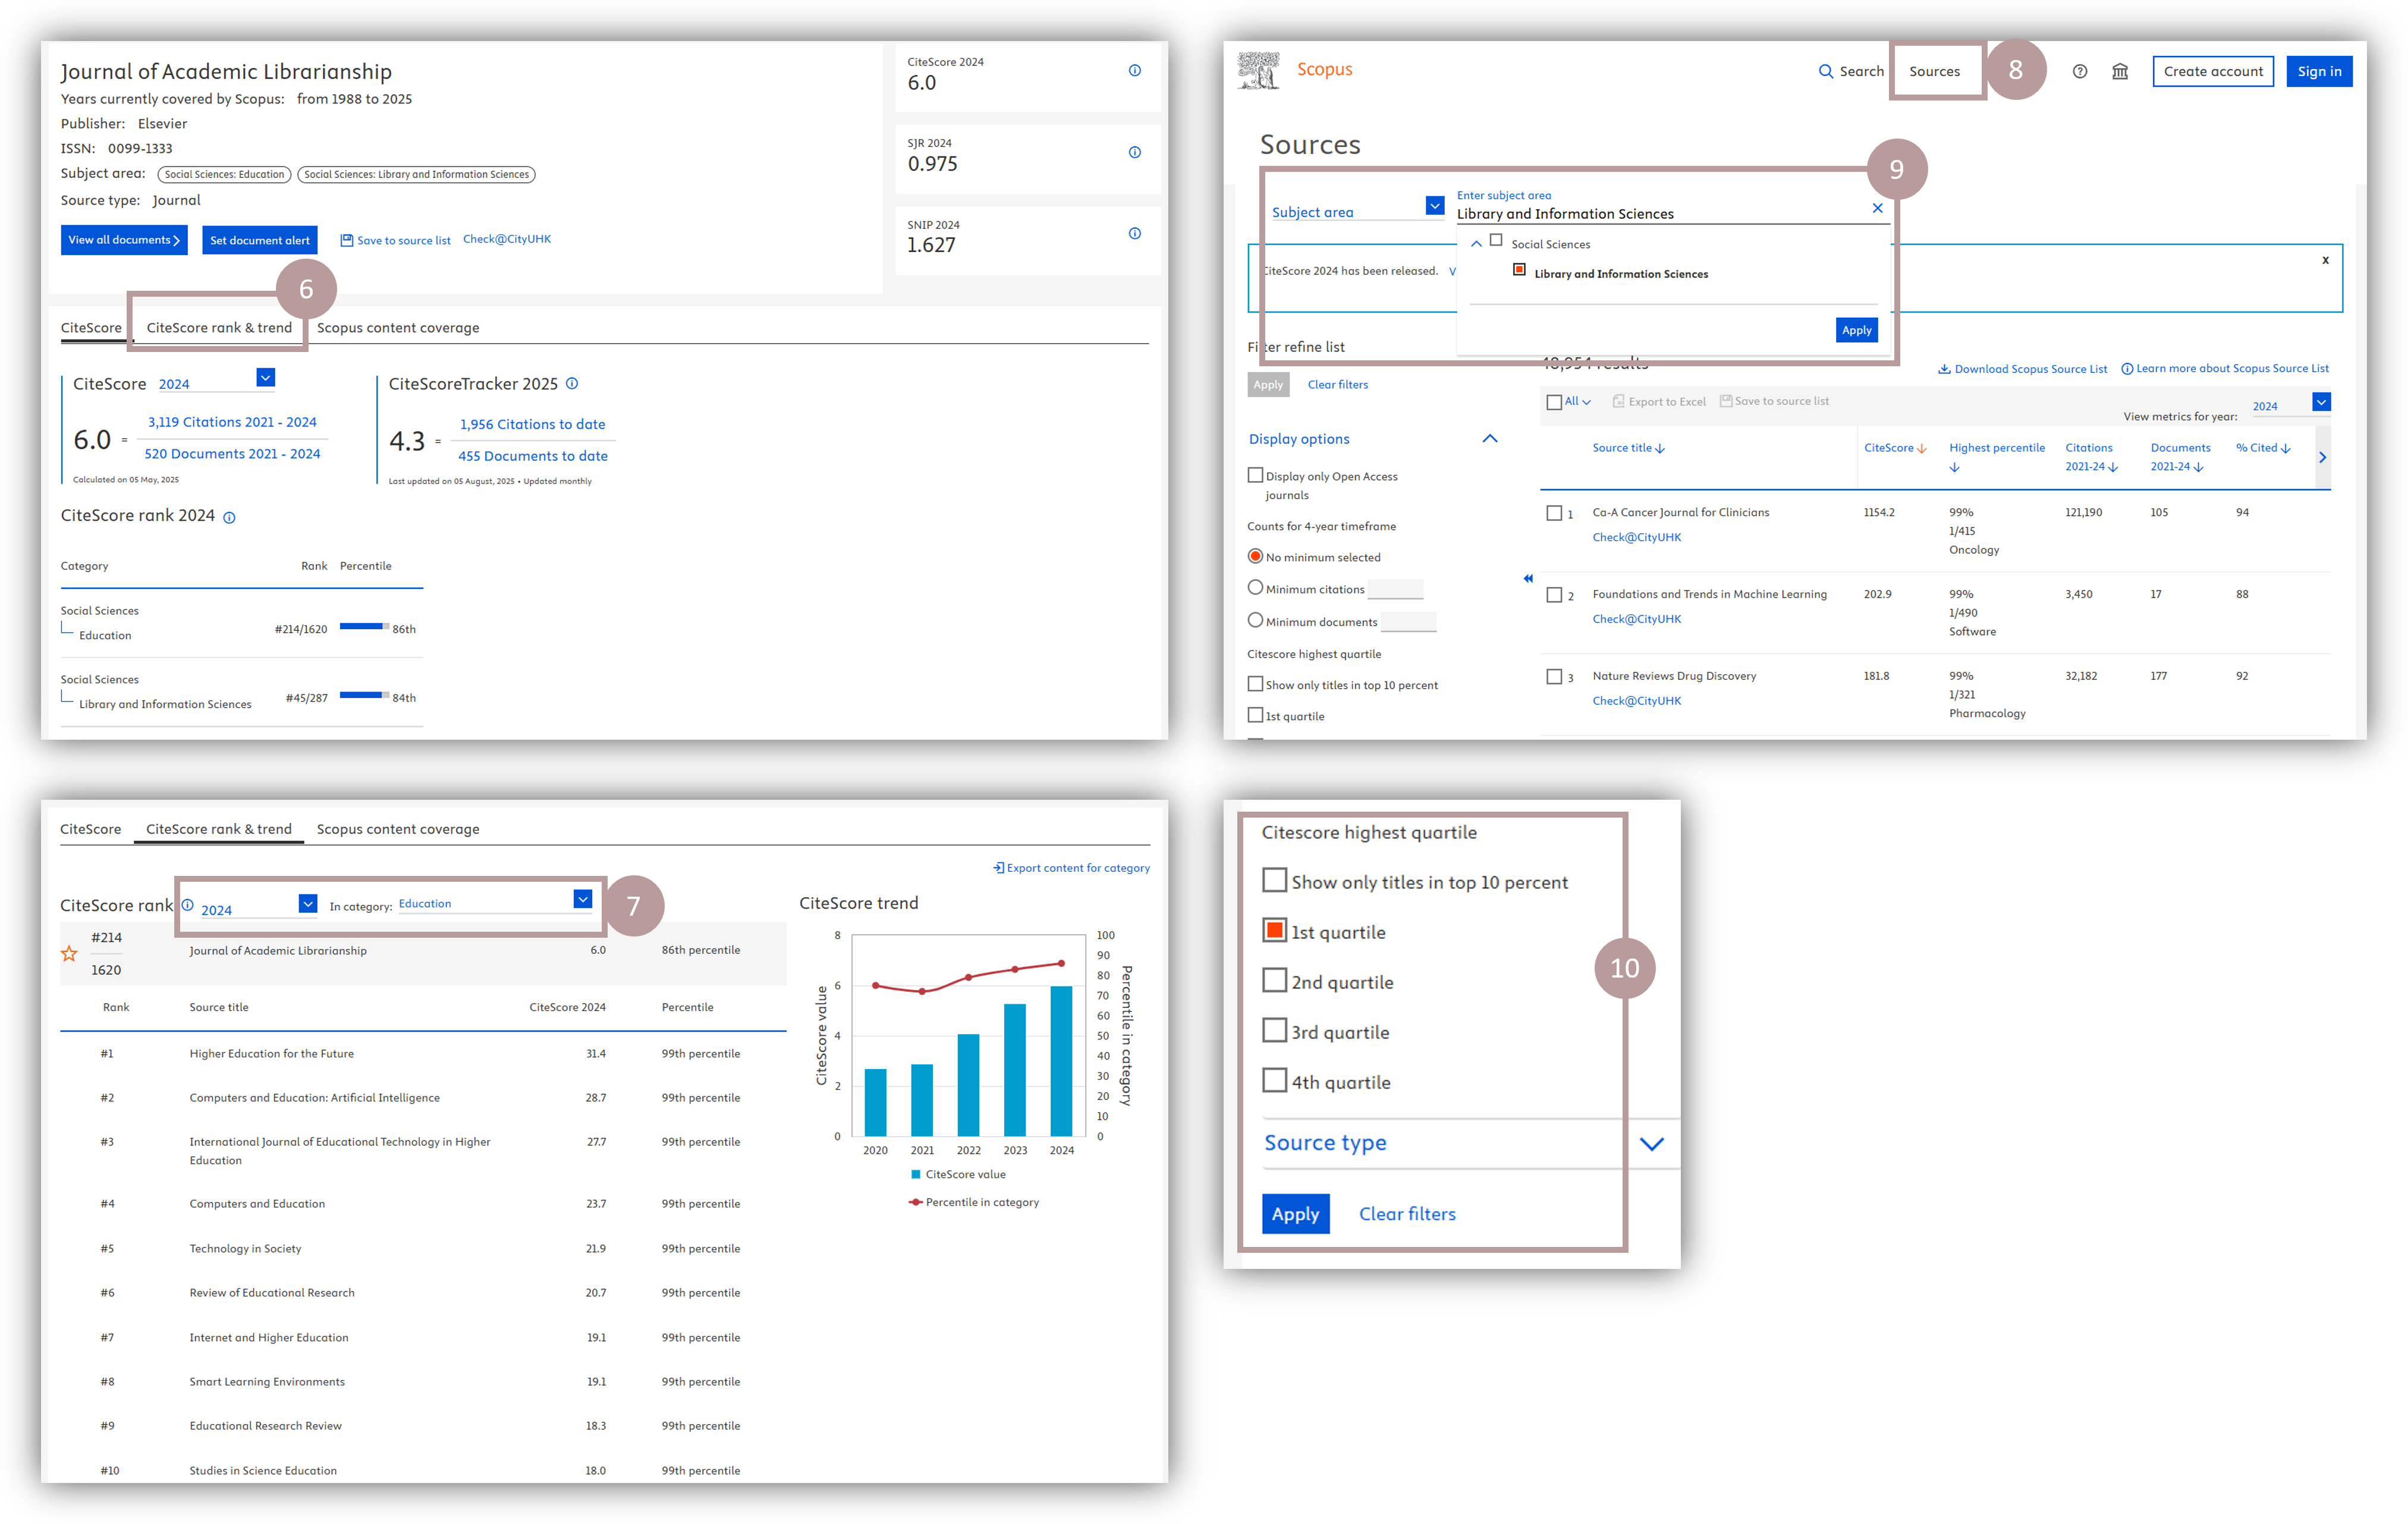
1. On Scopus, click "Sources" at the top of the page to view the Source list. 2. You can sort the listed sources using column filters, like arranging source titles alphabetically, or by CiteScore in descending or ascending order, or by Percentile in descending or ascending order, etc. 3. If you have a particular journal in mind, search it by title or ISSN. 4. Click the journal name and view the journal details on the next page. 5. Scroll down to view the journal's CiteScore, as well as its Rank and Percentile in each category. 6. Click "CiteScore rank & trend" to view the detailed rank table and trend bar chart on the next page. 7. View the detailed rank table and trend bar chart for various years and categories. 8. To find journals in a specific subject area across different quartiles, click "Sources" to return to the Source list. 9. Select "Subject area", enter your category, and click "Apply". 10. Select your desired journal quartile (e.g. 1st quartile) and click "Apply" to list the Q1 journals from that subject area.
|
What is it
SCImago Journal Rank (SJR) is a measure of the number of times an average paper in a particular journal is cited, similar to CiteScore. A major difference is that instead of each citation being counted as one, as with CiteScore, the SJR assigns each citation a value greater or less than 1.00 based on the rank of the citing journal, considering its subject field and prestige. The weighting is calculated using a three-year window of measurement and uses the Scopus database.

The calculation is based on the idea that higher SJR journals contribute more valuable citations compared to lower SJR journals. In other words, citations issued by more important journals will be more valuable than those issued by less important ones. This 'importance' will be computed recursively, i.e., the important journals will be those which in turn receive many citations from other important journals. Authors can use SJR to guide their publication decisions.
Detailed methodology: Guerrero-Bote, V. P., & Moya-Anegón, F. (2012). A further step forward in measuring journals’ scientific prestige: The SJR2 indicator. Journal of Informetrics, 6(4), 674-688. https://doi.org/10.1016/j.joi.2012.07.001
Reference: https://journalinsights.elsevier.com/journals/0959-3780/sjr
https://www.scimagojr.com/aboutus.php
How to find it
| Scopus > |
|
1. On Scopus, click "Sources" on the top of the page. 2. Click the arrow to scroll the header to view the SJR next to each title on the journal list. 3. If you have a particular journal in mind, search it by title or ISSN. 4. Click the arrow to scroll the header to view the SJR of the journal. 5. Click the journal name and view the SJR on the next page.
|
| SCImago > |
|
1. Go to SCImago, click "Journal Rankings" to view the SJR next to each title on the journal list. 2. If you have a particular journal in mind, search it by title or ISSN and select it on the next page. 3. On the journal page, scroll down to the middle until you see a graph labelled "SJR". Mouse over the graph to view SJR by year. 4. You can also click on the table icon to switch to the table view and see the SJR metrics in a tabular format.
|
What is it
Source Normalized Impact per Paper (SNIP) quantifies the contextual citation impact of a source by taking into account the total number of citations within a specific subject field. It evaluates the citations per publication of each journal and compares it to the citation potential of the field, which is determined by the set of publications that cite that particular journal. SNIP facilitates a direct comparison of sources across diverse subject fields.

Detailed methodology: Waltman, L., Van Eck, N. J., Van Leeuwen, T. N., & Visser, M. S. (2013). Some modifications to the SNIP journal impact indicator. Journal of Informetrics, 7(2), 272-285. https://doi.org/10.1016/j.joi.2012.11.011
Reference: https://www.journalindicators.com/methodology
How to find it
| Scopus > |
|
1. On Scopus, click "Sources" on the top of the page. 2. Click the arrow to scroll the header to view the SNIP next to each title on the journal list. 3. If you have a particular journal in mind, search it by title or ISSN. 4. Click the arrow to scroll the header to view the SNIP of the journal. 5. Click the journal name and view the SNIP on the next page.
|
What is it
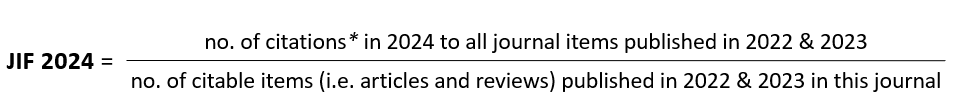
Journal Impact Factor (JIF) is a metric generated by Clarivate's Journal Citation Reports (JCR) from data indexed in the Web of Science Core Collection. The calculation is based on the number of citations a journal's articles receive in a given year divided by the total number of articles published by the journal in the preceding two years. Beginning with the JIF 2022, all journals in the Web of Science Core Collection, including Science Citation Index Expanded (SCIE), Social Science Citation Index (SSCI), Arts & Humanities Citation Index (AHCI) and Emerging Sources Citation Index (ESCI) are with JIFs.
The resulting number represents the average number of citations received per article. Higher impact factors are generally associated with journals that are considered more influential and have a greater impact in their respective fields.
*Excludes citations to and from retracted and withdrawn publications
Reference: https://clarivate.com/academia-government/wp-content/uploads/sites/3/dlm_uploads/2025/06/Journal-Impact-Factor-Quick-Reference-Guide-1.pdf
https://clarivate.com/academia-government/wp-content/uploads/sites/3/dlm_uploads/2025/06/JCR-Reference-Guide-2025.pdf
How to find it
| Web of Science > |
|
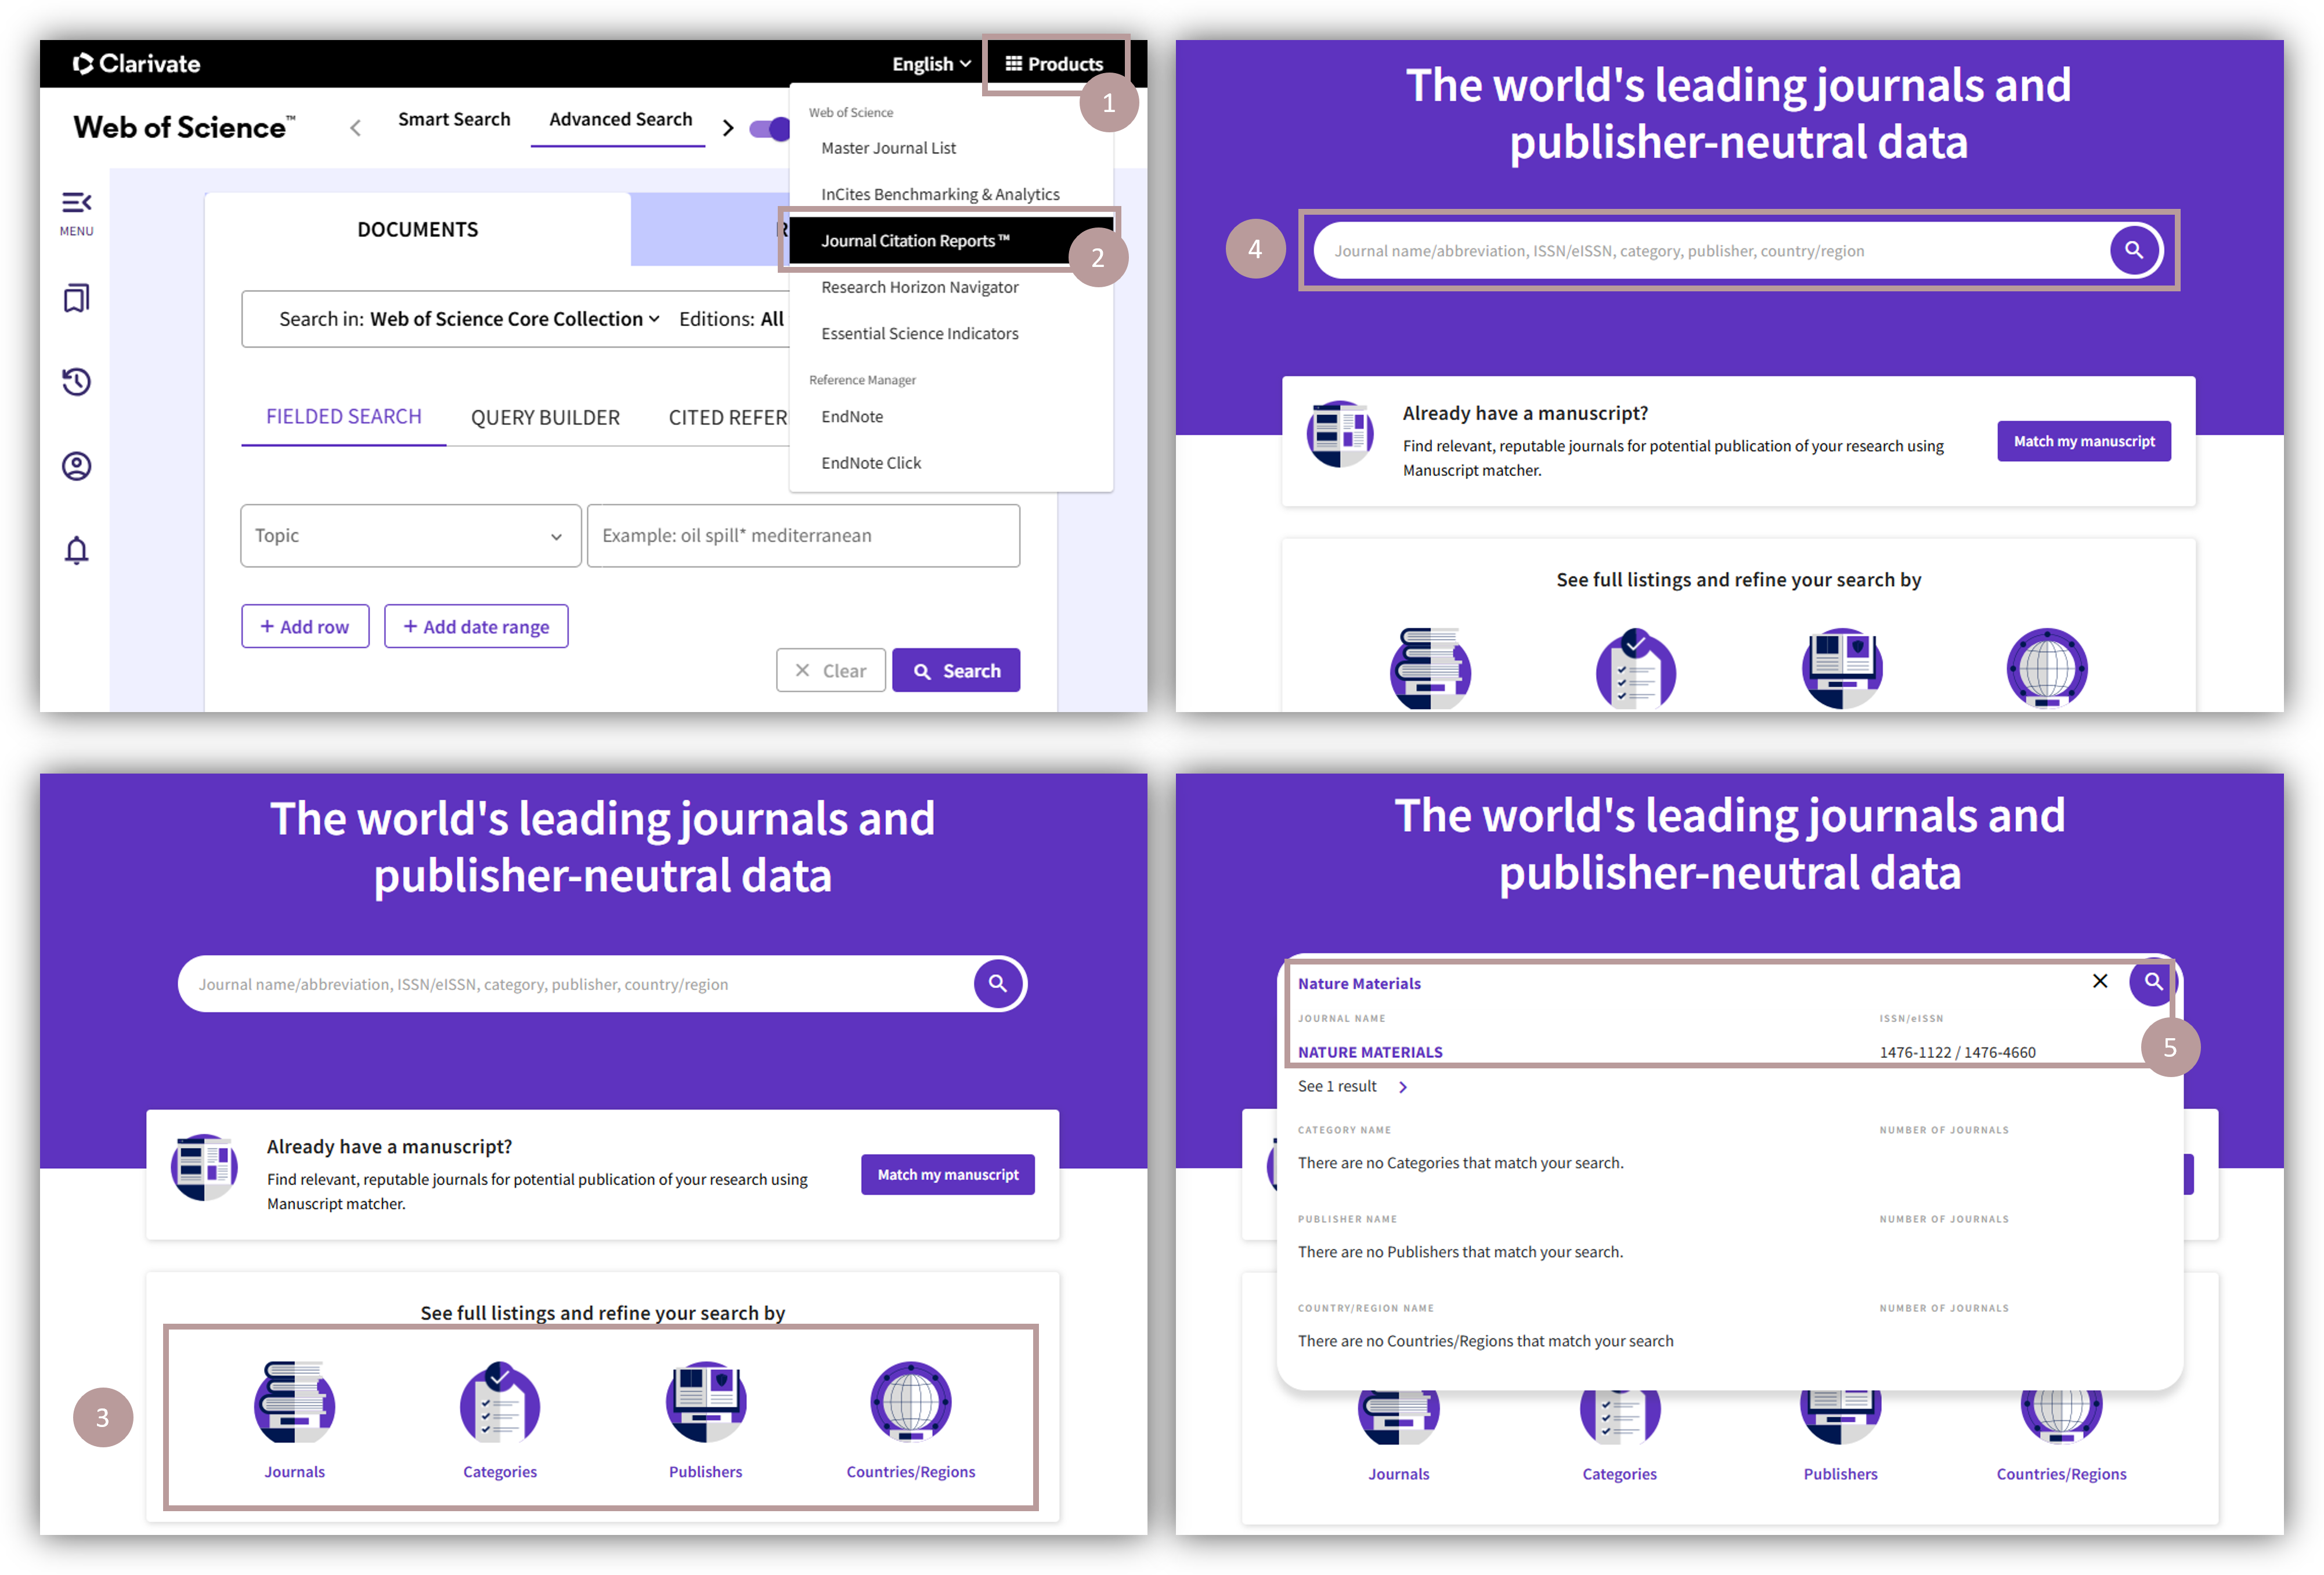
1. On Web of Science, click "Products" on the top right corner of the page. 2. Click "Journal Citation Reports". 3. You can click one of the icons to view journals by titles, categories, publishers or countries/regions. Click "Journals". The JIF is next to the journal name on the next page. 4. To assess the journal using additional metrics, click "Customize". 5. Check the desired metrics. 6. Click "Apply" to view the newly added metrics on the next page. 7. If you have a particular journal in mind, go back to the homepage of the Journal Citation Reports, and search the journal by title or ISSN. On the next page, scroll down to view the JIF. 8. Select one of the years to view JIF by year.
|
What is it
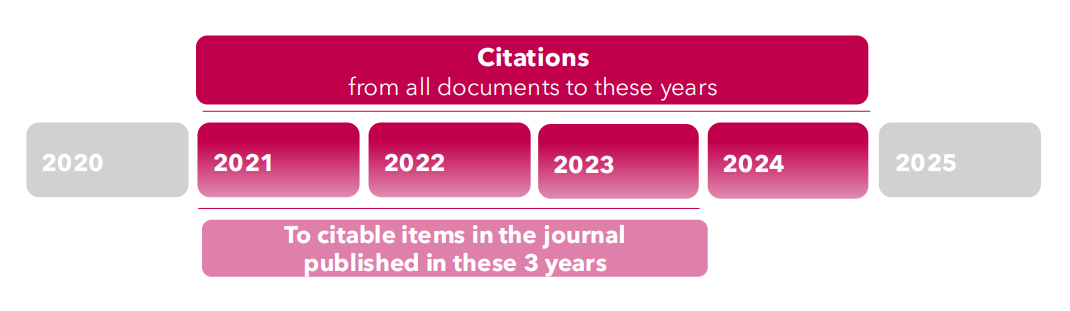
The 5-year Journal Impact Factor is the average number of times articles from the journal published in the past five years have been cited in the JCR year. It is calculated by dividing the number of citations in the JCR year by the total number of articles published in the five previous years.

How to find it
| Web of Science > |
|
1. On Web of Science, click "Products" on the top right corner of the page. 2. Click "Journal Citation Reports". 3. You can click one of the icons to view journals by titles, categories, publishers or countries/regions. Click "Journals" to view journal metrics on the next page. 4. To assess the 5 Year JIF, click "Customize". 5. Check "5 Year JIF". 6. Click "Apply" to view the newly added metric on the next page. 7. If you have a particular journal in mind, go back to the homepage of the Journal Citation Reports, and search the journal by title or ISSN. 8. On the next page, scroll down to the end to view the "5 Year Impact Factor" under "Additional metrics".
|
What is it
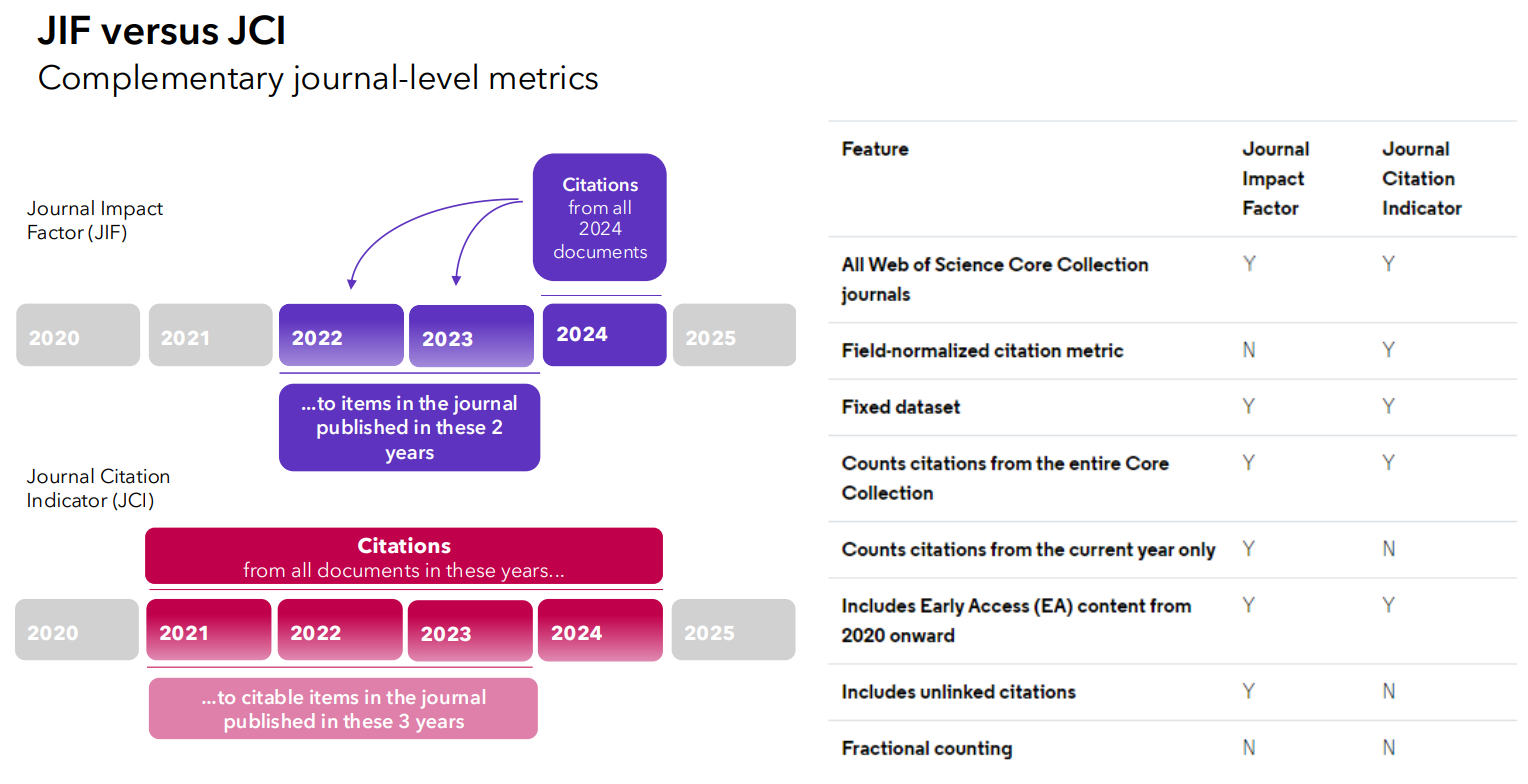
Journal Citation Indicator (JCI) is a category-normalized metric calculated for all journals in the Web of Science Core Collection, including the Science Citation Index Expanded (SCIE), Social Science Citation Index (SSCI), Arts & Humanities Citation Index (AHCI), and Emerging Sources Citation Index (ESCI). The JCI is the average Category Normalized Citation Impact (CNCI) of citable items (articles & reviews) published by a journal over a recent three-year period. For example, the 2024 JCI was calculated for journals that published citable items (i.e., articles or reviews) in 2021, 2022 and 2023, counting all citations they received from any document indexed between 2021 and 2024.
Because it is normalized, JCI allows comparisons across disciplines. As in the CNCI measurement, the JCI calculation controls for different fields, document types (articles, reviews, etc.) and year of publication. The resulting number represents the relative citation impact of a given journal as the ratio of citations compared to a global baseline. A value of 1.0 represents the world average, with values higher than 1.0 denoting higher-than-average citation impact and lower than 1.0 indicating less than average.
Reference: https://clarivate.com/academia-government/wp-content/uploads/sites/3/dlm_uploads/2025/06/JCR-Reference-Guide-2025.pdf
https://clarivate.com/wp-content/uploads/dlm_uploads/2021/05/Journal-Citation-Indicator-discussion-paper.pdf
How to find it
| Web of Science > |
|
1. On Web of Science, click "Products" on the top right corner of the page. 2. Click "Journal Citation Reports". 3. You can click one of the icons to view journals by titles, categories, publishers or countries/regions. Click "Journals". The JCI is next to the journal name on the next page. 4. To assess the journal using additional JCI metrics, click "Customize". 5. Check the desired metrics. 6. Click "Apply" to view the newly added metrics on the next page. 7. If you have a particular journal in mind, go back to the homepage of the Journal Citation Reports, and search the journal by title or ISSN. On the next page, scroll down to view the JCI.
|
What is 'Rank'
The JIF/JCI rank is based on sorting journals from highest to lowest JIF/JCI within the same journal category (Web of Science Research Areas) in Journal Citation Reports (JCR). Journals with the same JIF/JCI in a category receive the same rank. For journals that belong to multiple categories, a rank is assigned for each category.
What is 'Quartile'
Quartile is defined by a journal's ranking within its category. A "Z" value is calculated by dividing the rank position by the total number of journals in that category. The quartile is then determined according to where Z lies on a scale from 0 to 1. Z values range from 0 to 1 and correspond to the quartiles as follows:
The example below illustrates JIF Rank and Quartile. The calculation for JCI is similar.
| Journal | Journal Impact Factor (JIF) |
Rank | Z (Rank/Total number of journals) |
Quartile |
| Journal A | 1.9 | 1/10 | 0.1 | Q1 |
| Journal B | 1.6 | 2/10 | 0.2 | Q1 |
| Journal C | 1.4 | 3/10 | 0.3 | Q2 |
| Journal D | 1.3 | 4/10 | 0.4 | Q2 |
| Journal E | 1.3 | 4/10 | 0.4 | Q2 |
| Journal F | 1.2 | 6/10 | 0.6 | Q3 |
| Journal G | 1 | 7/10 | 0.7 | Q3 |
| Journal H | 0.8 | 8/10 | 0.8 | Q4 |
| Journal I | 0.8 | 8/10 | 0.8 | Q4 |
| Journal J | 0.6 | 10/10 | 1.0 | Q4 |
How to find JIF and JCI journal ranks, quartiles, and other metrics from JCR?
| Web of Science > |
|
1. On Web of Science, click "Products" on the top right corner of the page. 2. Click "Journal Citation Reports". 3. You can click one of the icons to view journals by titles, categories, publishers, or countries/regions. Click "Categories". 4. You can view Categories by Group or click "See all 254 Categories" to view all categories. 5. The number of journals is listed next to each category. 6. Click a category to view the metrics. 7. To assess journals within the same category using additional metrics, click "Customize". 8. Check the desired metrics. E.g. 2024 JIF, JIF Rank, 5 Year JIF Quartile, 2024 JCI, JCI Rank, JCI Quartile, JCI Percentile, JIF Percentile, JIF Quartile, etc. 9. Click "Apply" to view the newly added metrics on the next page. 10. Click "Export" and choose "XLS" for categories with 600 journals or fewer. Each file exports only the first 600 records. (You must sign in with your account before exporting the file.) 11. For categories with more than 600 journals, use the sorting function. Select a metric (with the arrow symbol) to sort the journals in ascending or descending order according to the metric. 12. By exporting two files with different sorting orders, you can download all the records. 13. If you have a particular journal in mind, go back to the homepage of the Journal Citation Reports, and search the journal by title or ISSN. On the next page, scroll down to view the Rank by Journal Impact Factor and Rank by Journal Citation Indicator.
|
What is 'Journal Impact Factor (JIF) Percentile'
By converting the JIF Rank into a percentile value, the JIF Percentile enables more insightful comparisons between different categories. A higher JIF Percentile indicates that the journal has a greater Impact Factor compared to its peers.
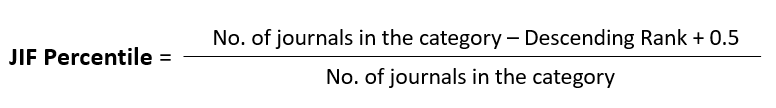
For example, the journal is ranked 120 out of 500 in a specific category.
The JIF Percentile is calculated as (500 - 120 + 0.5) / 500 = 0.761, which corresponds to the 76.1 Percentile.
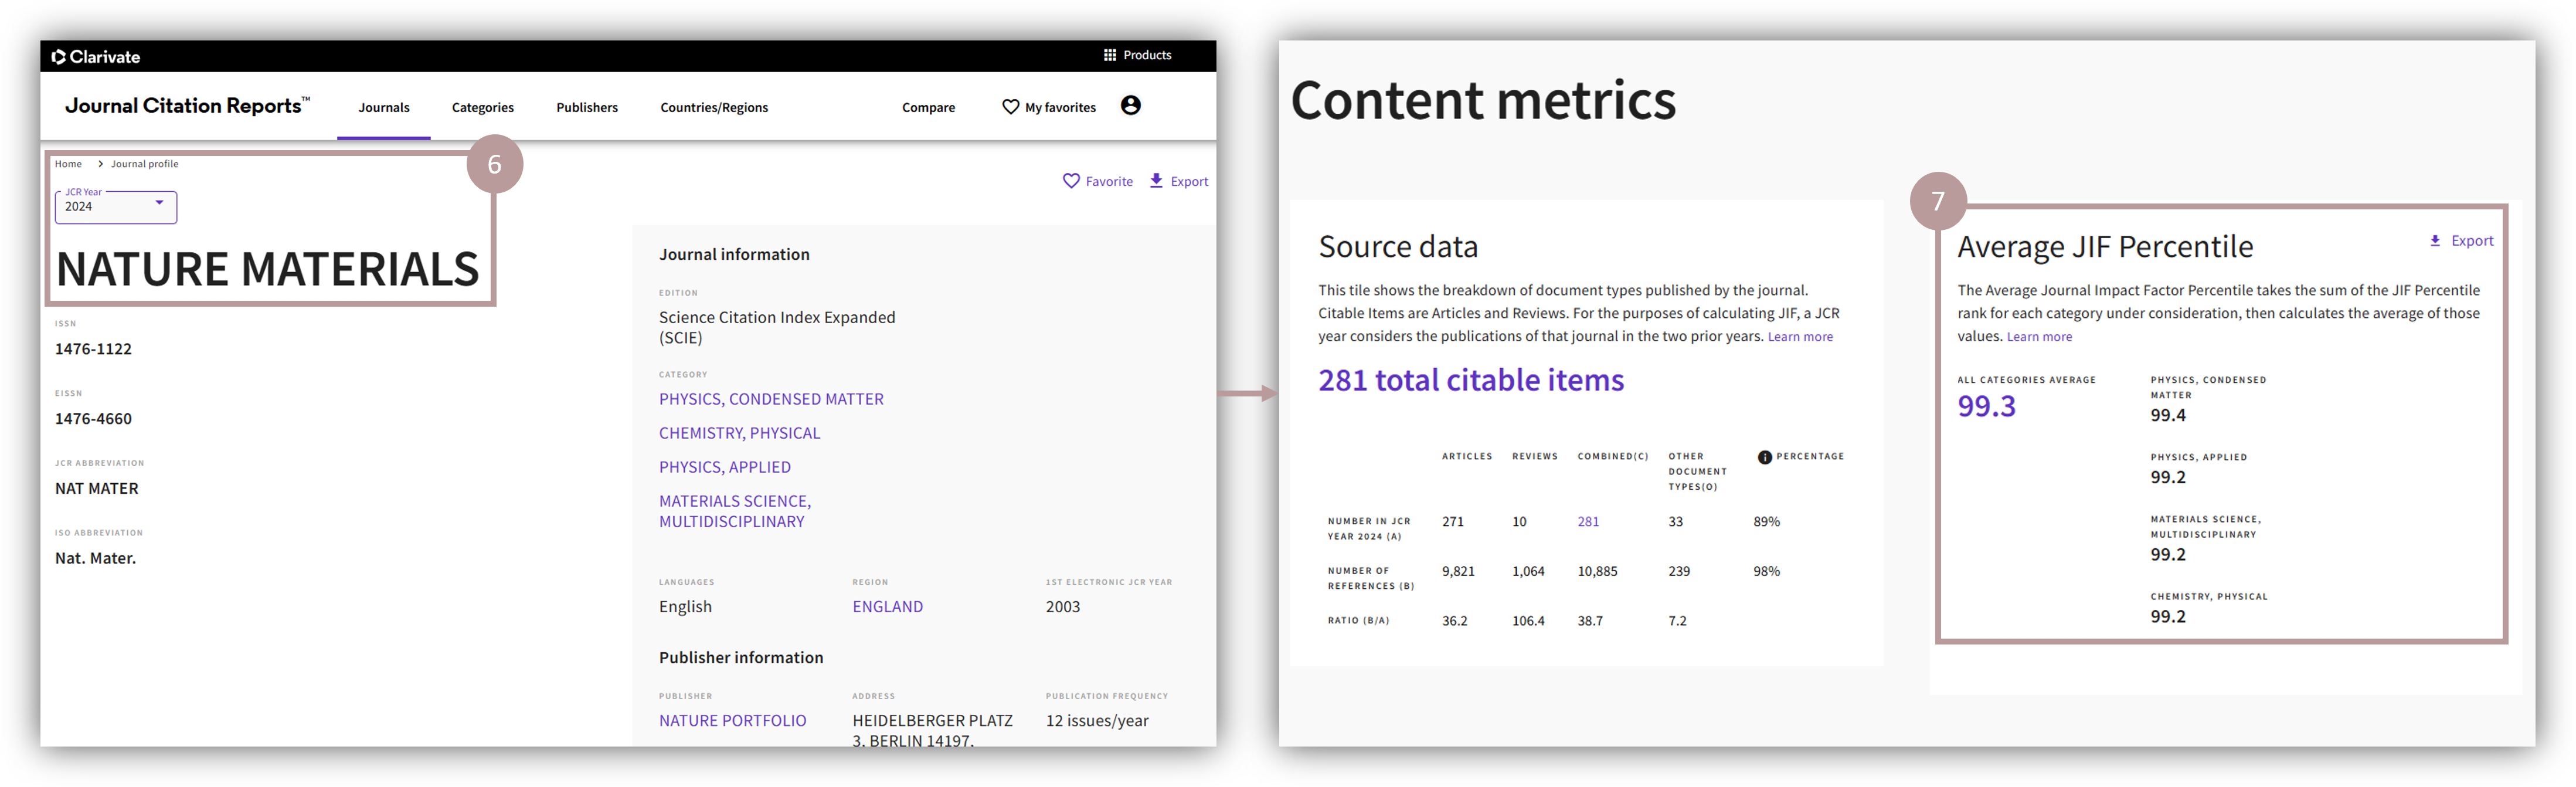
What is 'Average Journal Impact Factor (JIF) Percentile'
The Average JIF Percentile is the average of the sum of JIF Percentiles for each category. It facilitates cross-category comparisons.
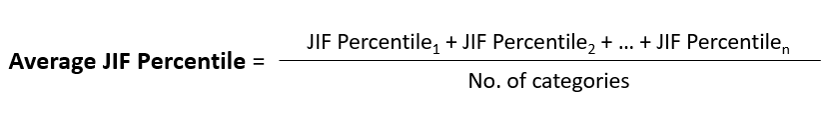
For example, Journal A has 2 categories associated with it:
| Journal | JIF | Category | Rank | JIF Percentile |
| Journal A | 10 | Category 1 | 20/120 | (120 - 20 + 0.5) / 120 = 83.75 |
| Category 2 | 45/200 | (200 - 45 + 0.5) / 200 = 77.75 | ||
| Average JIF Percentile | (83.75 + 77.75) / 2 = 80.75 | |||
References: https://support.clarivate.com/ScientificandAcademicResearch/s/article/Journal-Citation-Reports-Quartile-rankings-and-other-metrics?language=en_US
https://journalcitationreports.zendesk.com/hc/en-gb/articles/28351666061457-Glossary#h_01J7P0JFZSQ0YDJNFJ8WD12MWC
How to locate the Average JIF Percentile in JCR?
| Web of Science > |
|
1. On Web of Science, click "Products" on the top right corner of the page. 2. Click "Journal Citation Reports". 3. You can click one of the icons to view journals by titles, categories, publishers, or countries/regions. 4. Alternatively, you can find the journal using the search function. 5. Search the journal by title or ISSN. 6. Go to the particular journal profile. 7. Scroll down to view the Average JIF Percentile under the Content metrics section.
|