|
Article Metrics |
Article-level metrics (ALMs) offer insights into the influence and reach of individual scholarly articles. By analyzing the metrics, authors can gain a comprehensive understanding of how their work is received and engaged with by the scholarly community. ALMs not only assist in identifying popular and influential topics but also enable authors to discover potential collaborators based on the visibility and impact of their articles. Like author-level metrics, it's important to acknowledge that the availability and scope of ALMs vary across different platforms, databases, disciplines, and publication venues. Researchers should be mindful of these variations to ensure a comprehensive assessment of their article's impact and to contextualize the metrics properly within their specific field of study. |
What is it
Citation count at the article level represents the frequency with which a publication has been referenced by other scholarly works. It serves as a widely adopted metric for assessing the influence and significance of an article within the academic community. The general consensus is that a higher number of citations indicates a greater level of impact, as it suggests the work has garnered attention and recognition from other researchers.
Citation counts, while cumulative, should be interpreted with caution due to their lack of context and susceptibility to manipulation. Moreover, the counts may vary across source databases depending on their included content. Different document types also receive varying citation frequencies, with review articles often receiving more citations than research papers.
Citation count is available in most academic platforms and databases. Besides Scopus, Web of Science and Google Scholar, it can also be retrieved for publications in Academic Search Premier (via EBSCOhost), ACM Digital Library, JSTOR, MathSciNet, ProQuest Databases, ScienceDirect, and more.
How to find it
| Scopus (inc. how to excl. self-citations) > |
|
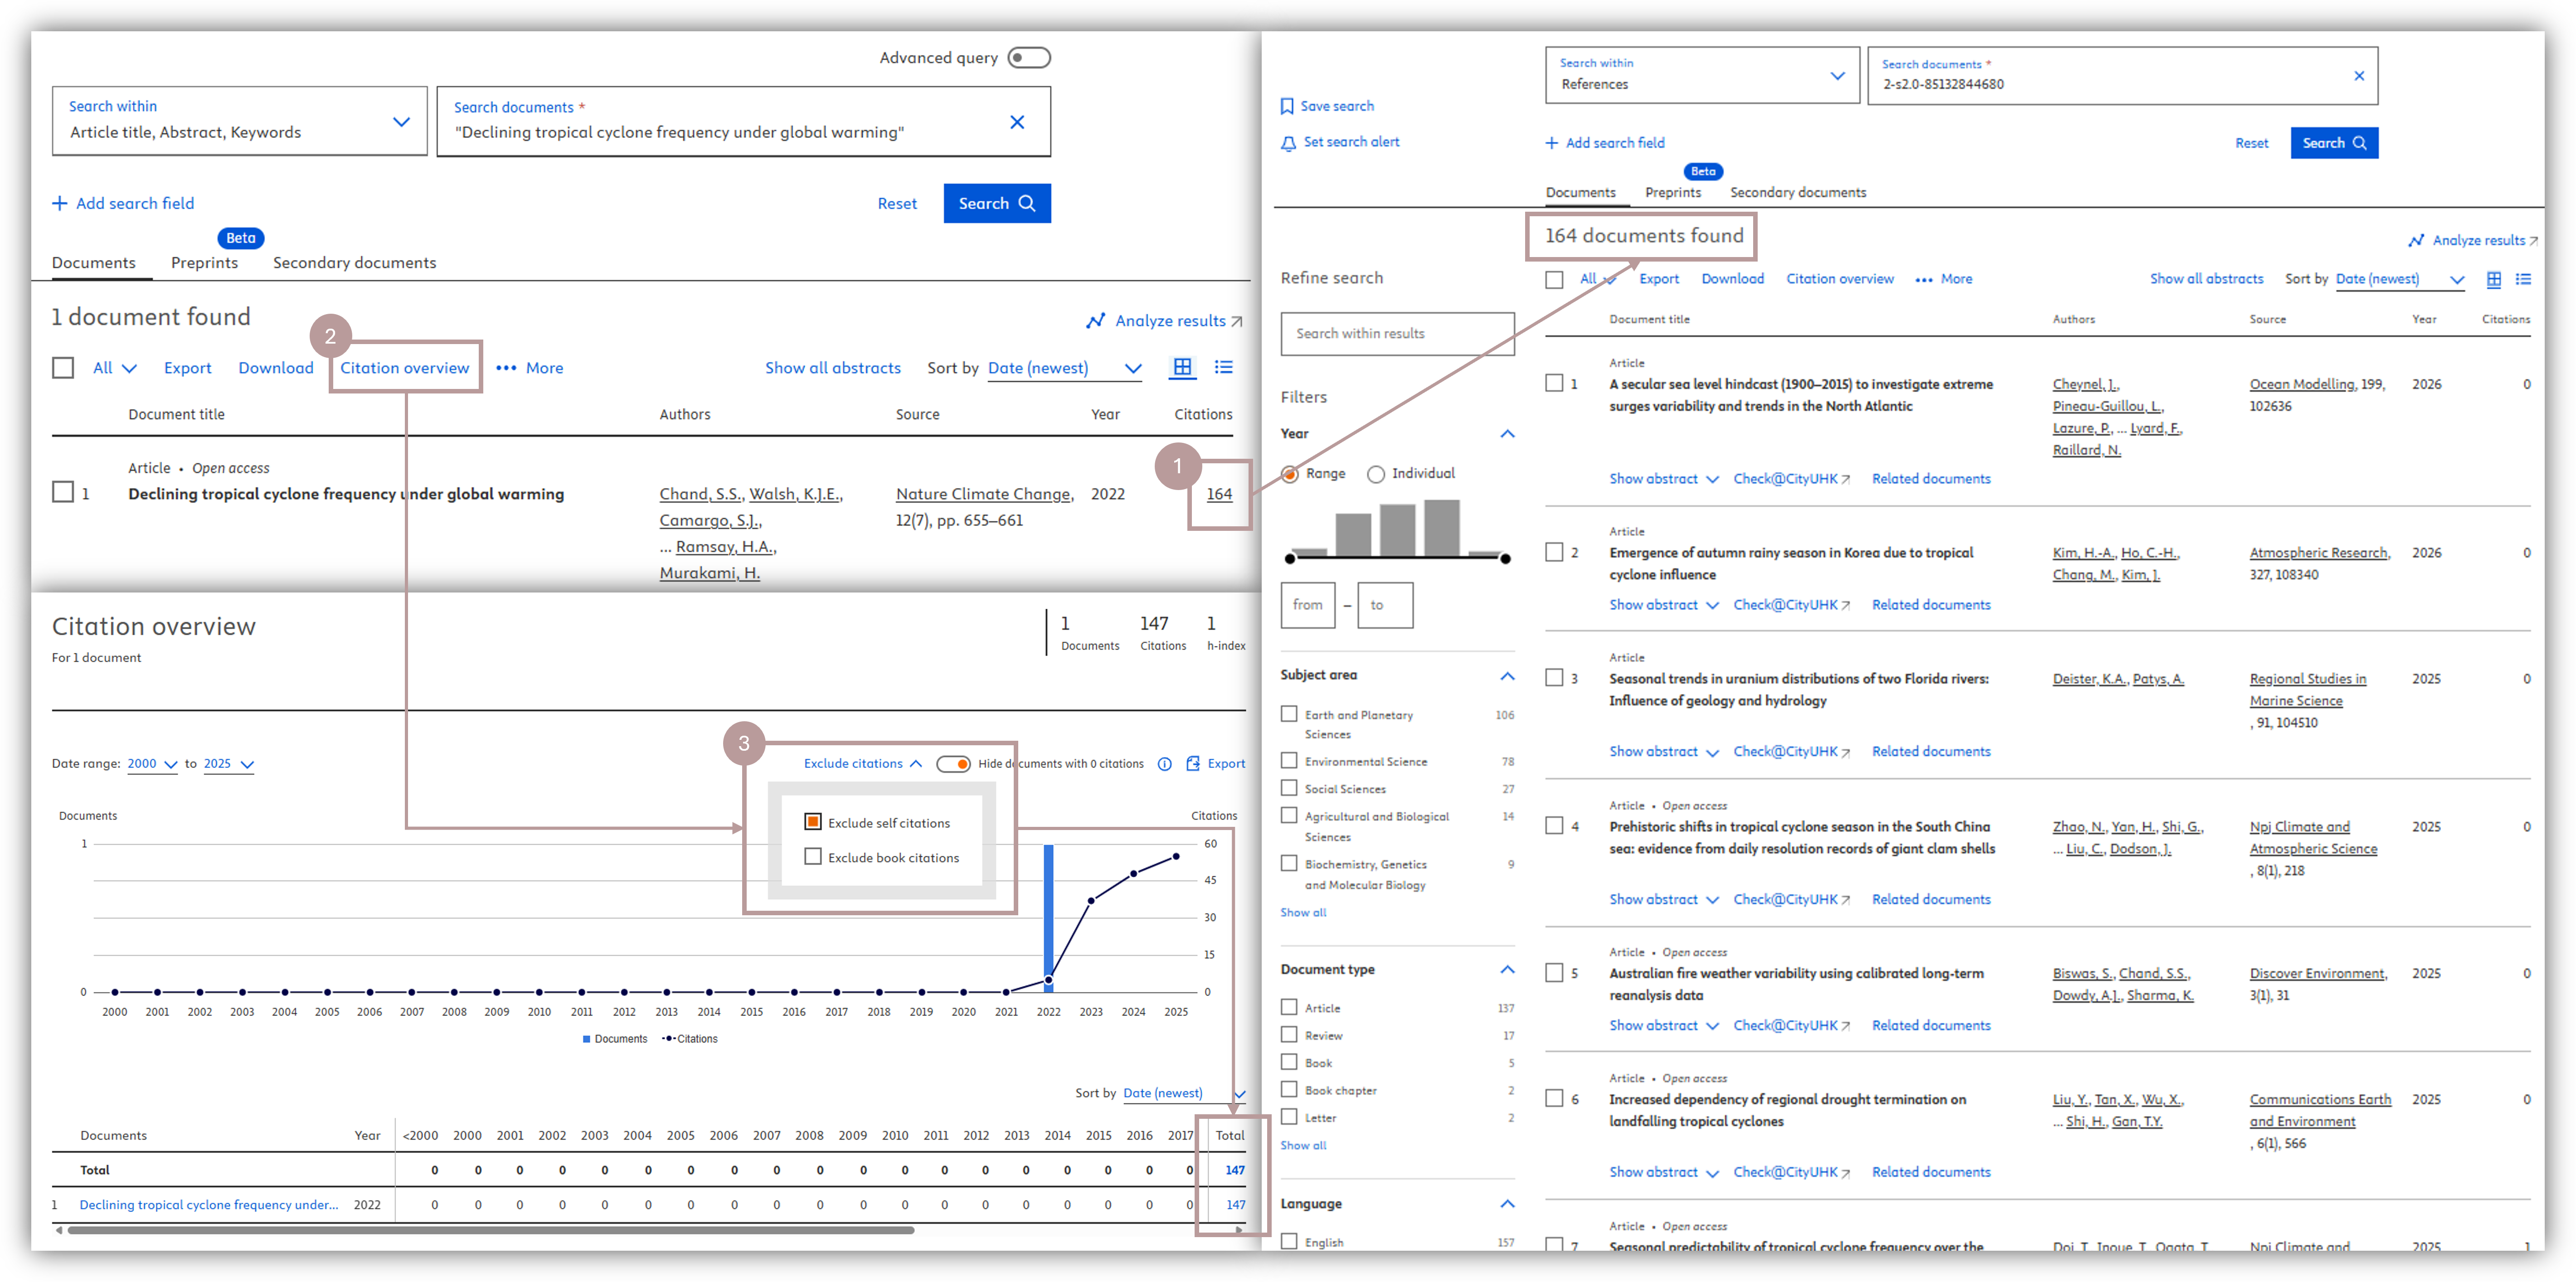
1. Below the search box, the citations are in the right-most column of the publication record. Click the number to view the publications that have cited this publication. 2. To view citation count without self-citations or citations from books, click "Citation overview". 3. Check the box to exclude self-citations, and update. The updated citations of the publications can be found in the lower part of the page.
|
| Web of Science (inc. how to excl. self-citations) > |
|
1. Below the search box, the citations are in the right-most section of the publication record. Click the number to view the publications that have cited this publication. 2. To view citation count without self-citations, click "See all" under "Researcher Profiles". 3. In the search box, key in the author name of the publication that has been cited. 4. Check the author's name. 5. Click "Exclude" to exclude the author's self-citations and view the updated citations on the next page. To exclude self-citations of all authors of a publication, check all names in step 4 and exclude them in step 5.
|
| Google Scholar > |
|
Citations of each publication can be found next to the record on the Google Scholar page. Click the number to view the publications that have cited this publication. The guide Build your Google Scholar profile shows more information on Google Scholar.
|
What is it (Video)
Field-Weighted Citation Impact (FWCI) is a normalized indicator of citation impact. At article level, it measures the relative number of citations received by a publication in comparison to the average number of citations received by similar publications with the same publication year, publication type, and discipline (by default, All Science Journal Classification Codes (ASJC)). An FWCI of 1.00 means that the publication has been cited just as expected as the global average for similar publications. More than 1.00 means above average, and less than 1.00 means below average. For example, an FWCI of 1.51 indicates 51% more cited than the world average, and an FWCI of 0.85 indicates 15% less cited than the world average.
See also Author-Level FWCI.

How to find it (Video)
| Scopus > |
|
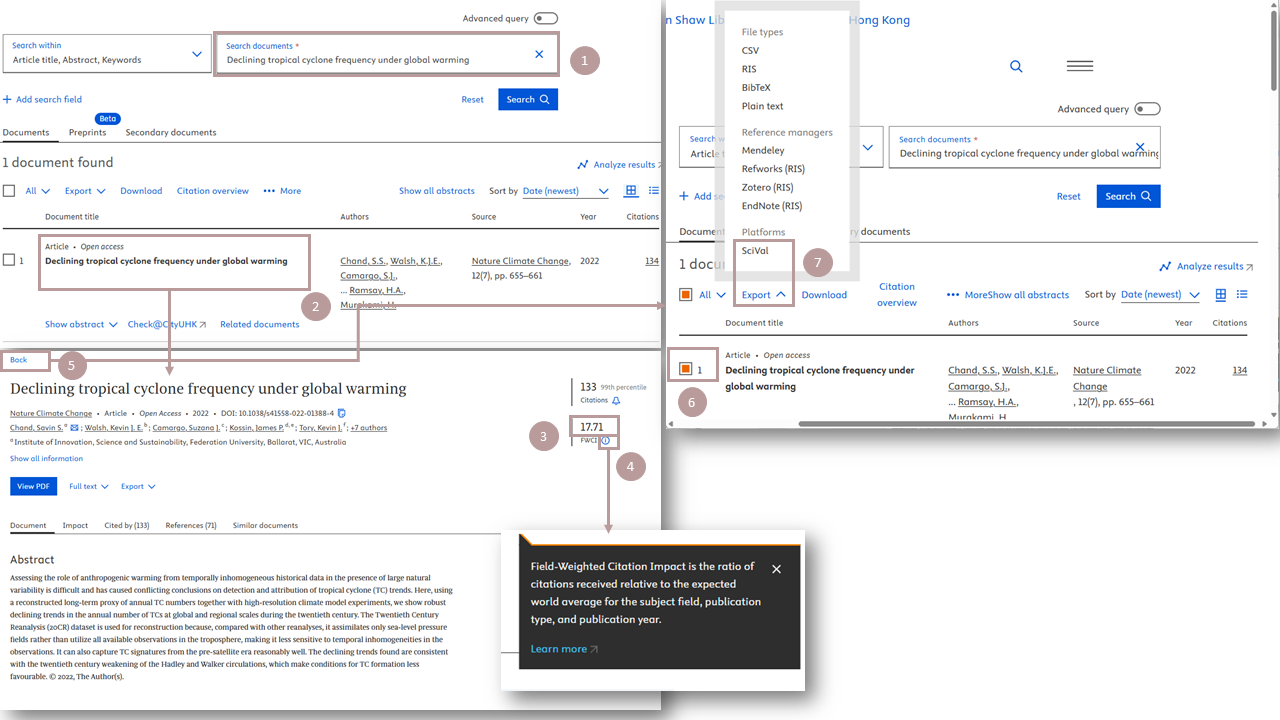
1. Go to Scopus and search for the article. 2. Click the title of the article and go to the record page. 3. On the record page, the FWCI can be found on the right side. 4. Click the question mark to view the definition of FWCI. 5. Click "Back" and go back to the search page. 6. Tick the article. 7. To view FWCI for more complete years, click "Export" and then "SciVal".
|
| SciVal > |
|
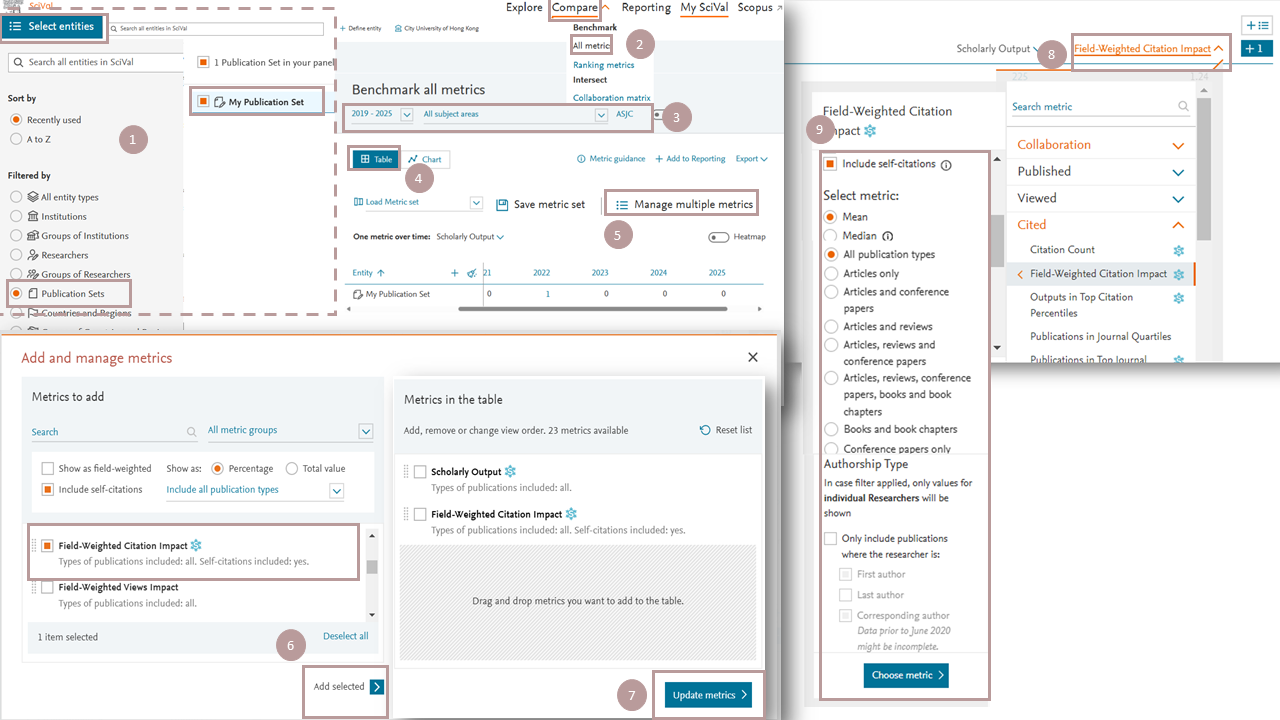
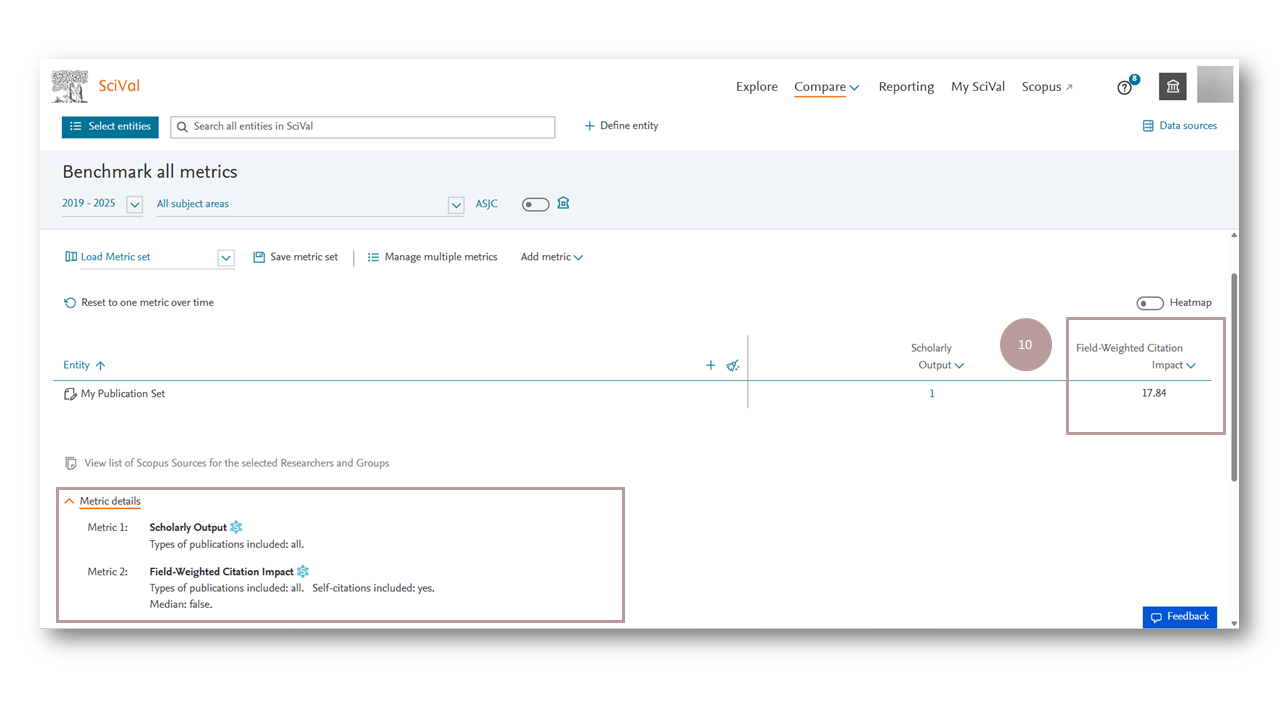
1. Go to SciVal, click "Select entity" and check the publication set under the "Publication Sets" panel. 2. Click "Compare" then Select "All metrics". 3. Select the desired year range and subject area. 4. Select the table view. 5. Click "Manage multiple metrics". 6. Select "Field-Weighted Citation Impact" and "Add selected". 7. In the "Metrics in the table" panel, click "Update metrics". 8. Click "Field-Weighted Citation Impact". 9. Customize the metric by including/excluding self-citations, selecting publication types and author roles, and click "Choose metric". 10. View the updated "Field-Weighted Citation Impact". The guide SciVal shows more information on how to use SciVal to do analysis and benchmarking.
|
What is it
"Outputs in Top Citation Percentiles" reveals the level to which the publications are included in the most highly cited percentiles within Scopus, captured by SciVal. SciVal calculates the citation counts that serve as thresholds for the top 1%, 5%, 10%, and 25% most-cited papers in Scopus per publication year. These citation thresholds are regularly updated on a weekly basis with each new snapshot of Scopus data. To determine these thresholds, global publications for each year are extracted from Scopus and arranged in descending order based on citation count. The publications are then divided into 100 equal percentiles, and the corresponding citation thresholds are recorded. Using these citation thresholds, SciVal calculates the number of an entity's publications that fall within each percentile range.
How to find it
| SciVal > |
|
1. Go to SciVal, check the publication set under the "Publication Sets" panel. 2. Select the Benchmarking module. 3. Select the desired year range and subject area. 4. Select the table view. 5. Select "Benchmarking multiple metrics" and "Add multiple metrics at once". 6. Select "Outputs in Top Citation Percentiles" and "Add selected". 7. In the "Metrics in the table" panel, click "Update metrics". 8. Click "Output in Top 10% Citation Percentiles (%)" which is the default value for this field. 9. Customize the metric by showing it as field-weighted, selecting the top% (i.e. 1%, 5%, 10% or 25%), publication types and author roles, and click "Choose metric". 10. View the updated "Output in Top x% Citation Percentiles". The guide SciVal shows more information on how to use SciVal to do analysis and benchmarking.
|
What is it
Category Normalized Citation Impact (CNCI) is a normalized measure of citation impact for similar publications across disciplines, provided by Web of Science and InCites. CNCI of a document is calculated by dividing the actual count of citing items by the expected citation rate for documents with the same document type, year of publication and subject area. For a single paper assigned to multiple subjects, the CNCI can be represented as the average of the ratios for of actual to expected citations for each subject area. For a group of papers, the CNCI value is the average of the values for each of the papers.
See also Author-Level CNCI.

How to find it
| InCites > |
|
1. Login to Web of Science. 2. Search for the publication. 3. Check the record on the result list. 4. Click "Export". 5. Click "InCites". 6. Name the dataset and click "Export". 7. You will receive an email in the mailbox that you used to register for Web of Science/InCites account. Click the link to open the dataset in InCites. 8. Click the dataset that was just imported from Web of Science. 9. This will bring you to the "Researchers" module. Click on the number under the field "Web of Science Documents". 10. This will bring you to the document page. View the CNCI in the table. The guide InCites shows more information on how to use InCites to do analysis and benchmarking.
|
What is it
Percentile in Subject Area represents the ranking of a paper within its specific category, document type, and database year, determined by the total number of citations it has received. A higher citation count corresponds to a larger percentile value, indicating a higher ranking. The papers with the highest percentiles are considered top-ranked. For example, documents within the top 10% will fall within the 90th to 100th percentiles. A paper with a percentile of 99 will be ranked higher than 99% of the other papers in its category, document type, and database year. The data is sourced from Web of Science and captured by InCites.
Reference: https://incites.zendesk.com/hc/en-gb/articles/33194835218449-Understanding-the-citation-percentile-indicator
https://clarivate.com/academia-government/wp-content/uploads/sites/3/dlm_uploads/2024/08/incites-user-guide.pdf
How to find it
| InCites > |
|
1. Login to Web of Science. 2. Search for the publication. 3. Check the record on the result list. 4. Click "Export". 5. Click "InCites". 6. Name the dataset and click "Export". 7. You will receive an email in the mailbox that you used to register for Web of Science/InCites account. Click the link to open the dataset in InCites. 8. Click the dataset that was just imported from Web of Science. 9. This will bring you to the "Researchers" module. Click on the number under the field "Web of Science Documents". 10. This will bring you to the document page. View the "Percentile in Subject Area" in the table. Note that for a journal of multiple categories in Journal Citation Reports, the highest percentile is shown here. The guide InCites shows more information on how to use InCites to do analysis and benchmarking.
|
What is it
The % Documents in Top 1% / 10% indicator is the top one / ten percent most cited documents (as defined in the description of Average Percentile, which is the mean of all the percentiles of all the papers in the set) in a given subject category, year and publication type divided by the total number of documents in a given set of documents, displayed as a percentage.
How to find it
| InCites > |
|
1. Login to Web of Science. 2. Search for the publication. 3. Check the record on the result list. 4. Click "Export". 5. Click "InCites". 6. Name the dataset and click "Export". 7. You will receive an email in the mailbox that you used to register for Web of Science/InCites account. Click the link to open the dataset in InCites. 8. Click the dataset that was just imported from Web of Science. 9. Click "Add indicator" and check "% Documents in Top 1%" and "% Documents in Top 10%", and click "Apply". 10. View the two newly added fields in the table. 11. Click the number under "Web of Science Documents" to call up the publication and view the details. The guide InCites shows more information on how to use InCites to do analysis and benchmarking.
|
What is it
Access/View Cout: The number of times an article has been visited or viewed on a website, showing the level of visibility and readership an article has received.
Download Count: The number of times an article has been accessed or downloaded by readers, showing the level of interest and readership an article has received.
Before publication:
After publication:
Reference:
1. How to increase citations, reach and impact - Editor Resources (taylorandfrancis.com)
2. 7 Tips to Increase Your Citation Score - iLovePhD
3. Study analyzing 420 million citations show OA outputs are cited by more researchers from more places – Access (librarylearningspace.com)
4. Why do papers from international collaborations get more citations? A bibliometric analysis of Library and Information Science papers | Scientometrics (springer.com)
5. Increasing visibility and discoverability of scholarly publications with academic search engine optimization
6. Preprints boost article citations and mentions | News | Nature Index
7. Increasing Impact of Scholarly Journal Articles (icaap.org)